Bring Your Own Observability
Send a copy of your fleet and Kafka telemetry to the monitoring product your team already uses — Datadog, Grafana Cloud, or New Relic — so you can alert on Streamtime infrastructure from the same place you watch everything else.
Streamtime keeps collecting metrics and logs for its own dashboards either way. Bring Your Own Observability adds a destination; it does not move or replace anything.
What gets sent
| Signal | Covers |
|---|---|
| Metrics | Node CPU, memory and disk; pod and workload state; Kafka broker health, throughput, partition and replication status, and JVM usage |
| Logs | Every pod in the fleet, including Kafka brokers, tagged with its namespace, pod, container and node |
Every metric and log carries the fleet and organization it came from, so one provider account can receive several fleets and still tell them apart.
Traces are not sent.
Before you start
You need an account with one of the supported products, and a credential that is allowed to ingest data. Each product calls this something different — the links below go to the vendor’s own instructions.
| Product | What Streamtime needs | Where to create it |
|---|---|---|
| Datadog | API key, and the site your account is on | API keys · Datadog sites |
| Grafana Cloud | OTLP endpoint, instance ID, access policy token | Send data using OTLP |
| New Relic | Ingest licence key, and your account region | New Relic API keys · Choose your region |
Grafana Cloud shows all three values together on one page. In Grafana Cloud, go to Connections → Add new connection → OpenTelemetry (OTLP) and generate a token there; the endpoint and instance ID are shown alongside it. The token needs write scope for both metrics and logs.
Step 1 — Add an observability provider
Go to Settings → Observability Providers and choose Add Observability Provider.
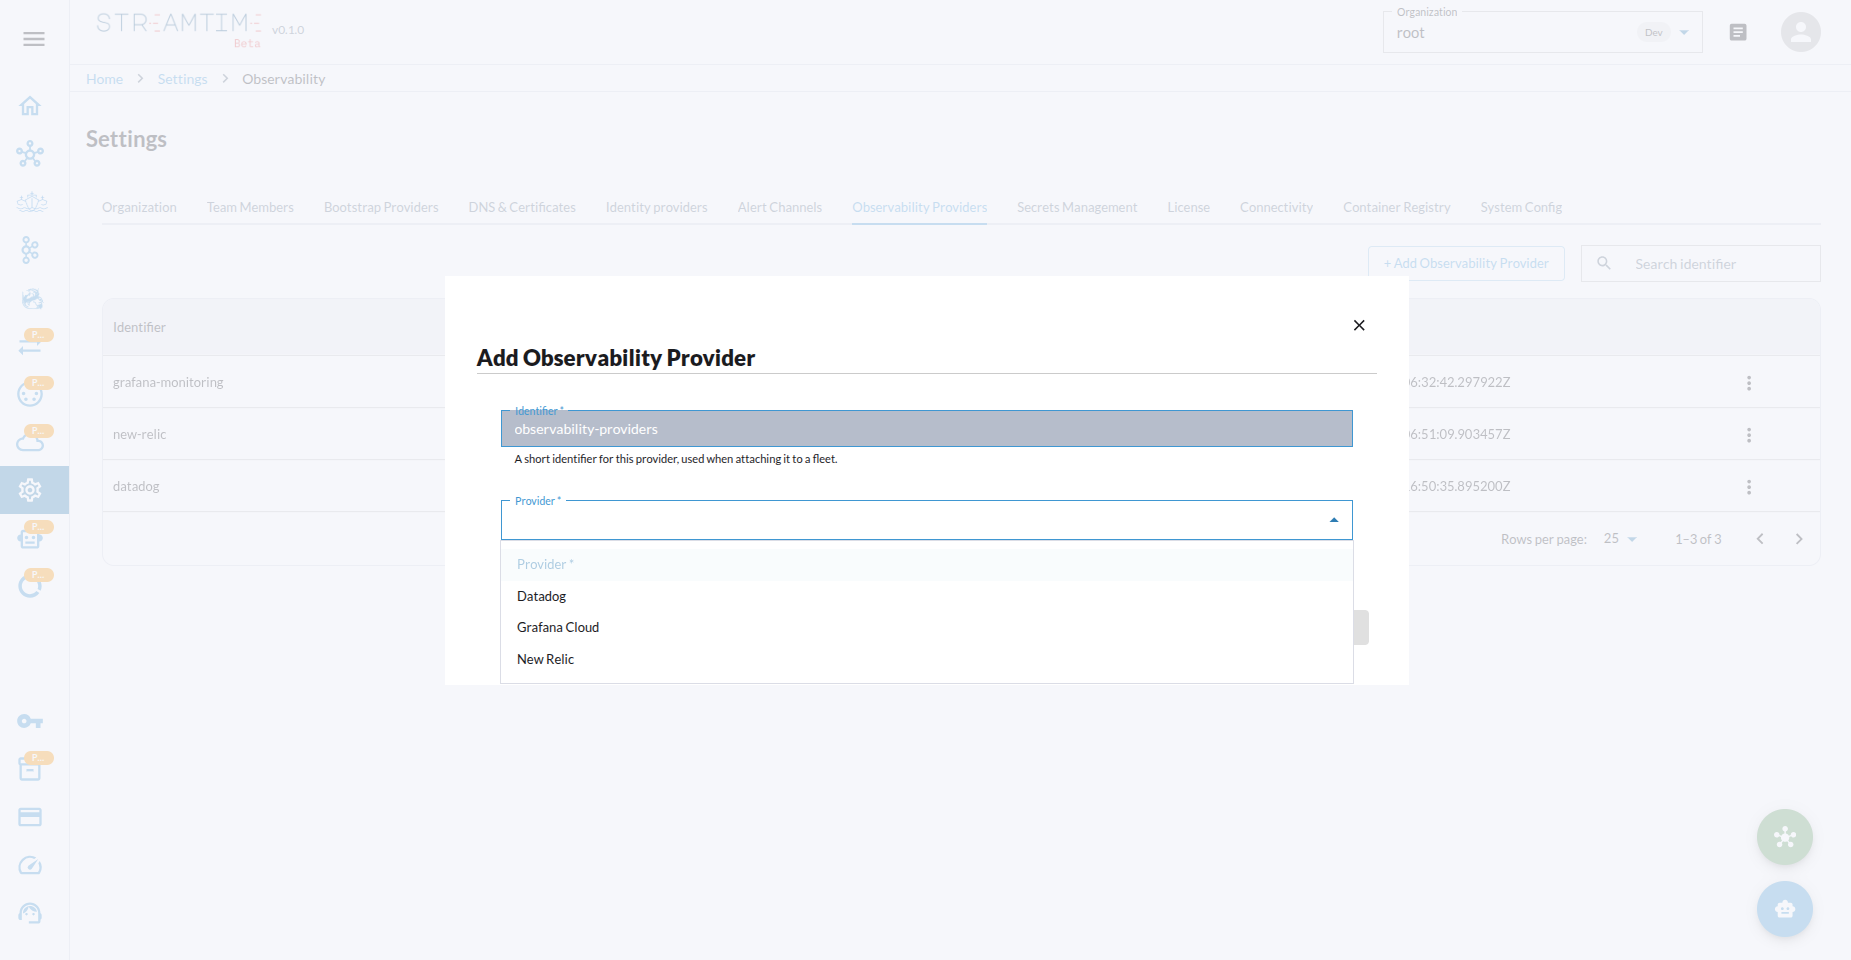
Fill in:
- Identifier — a short name for this provider, lowercase letters, numbers and dashes, up to 24 characters. You will pick it by this name when attaching it to a fleet, and it cannot be changed afterwards.
datadog-prodorgrafana-stagingwork well. - Provider — Datadog, Grafana Cloud, or New Relic.
- Credentials — the fields change to match the product you picked. See the table above for where each value comes from.
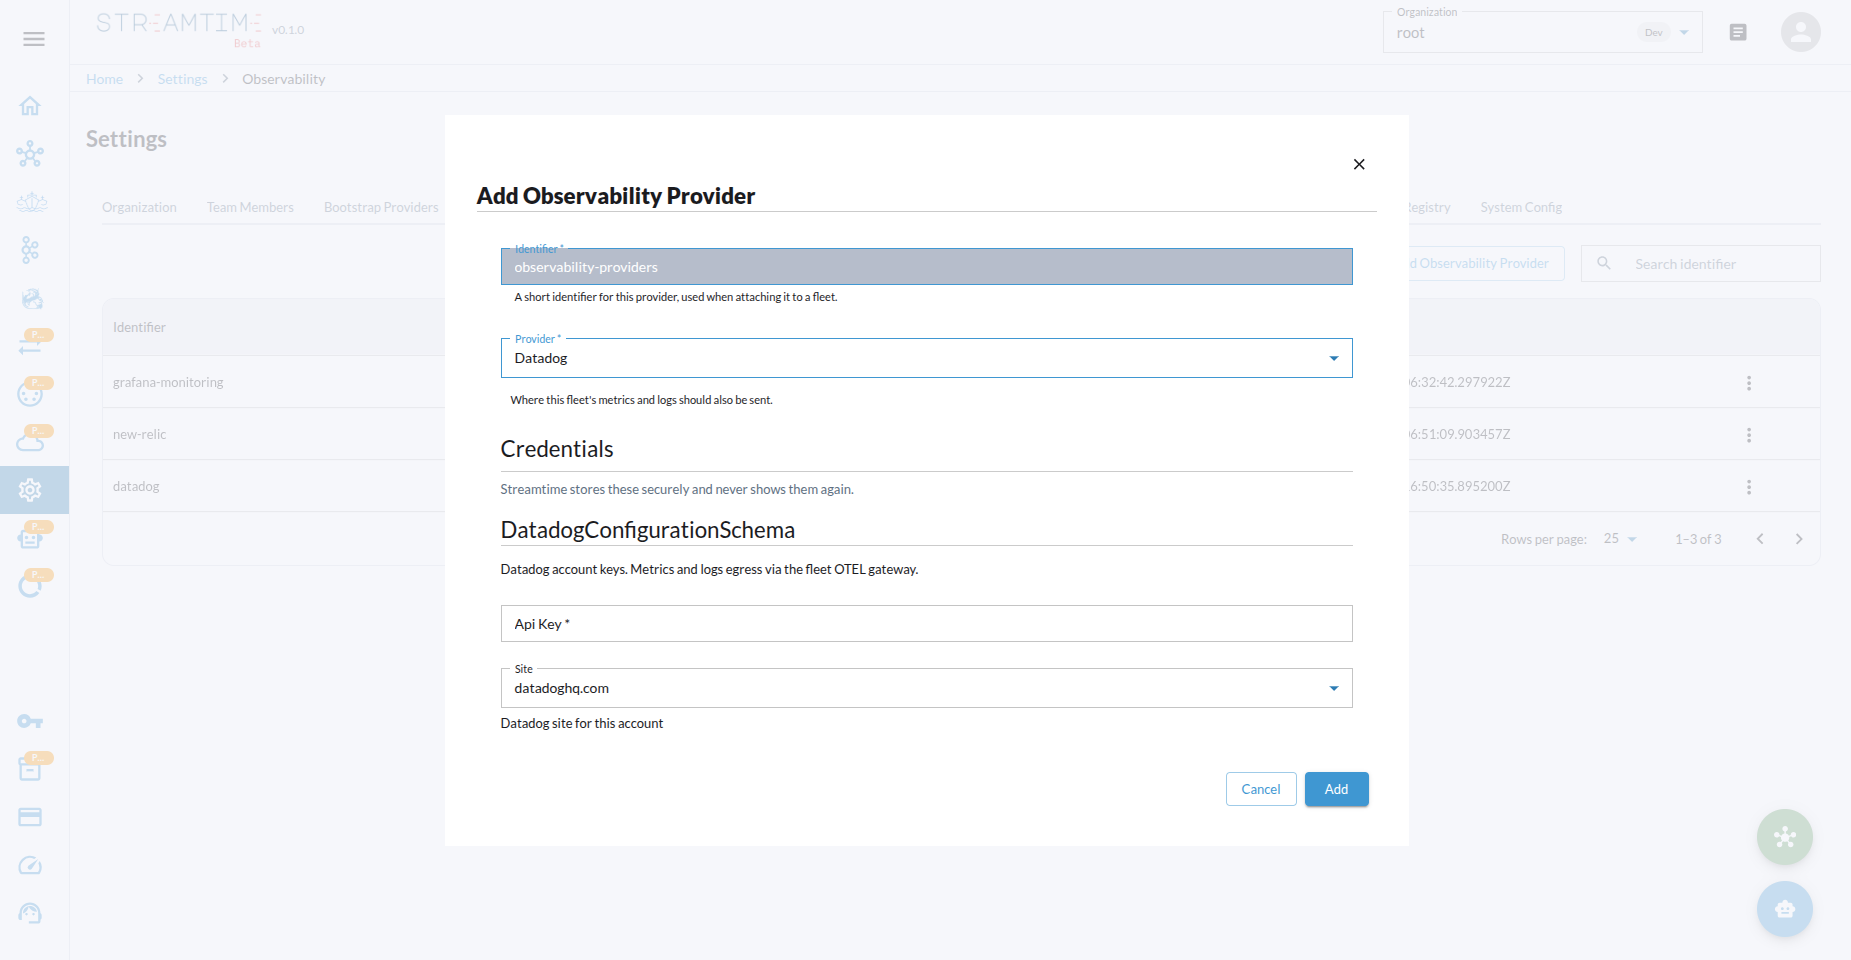
Credentials are stored encrypted and are never displayed again. When you reopen a provider to edit it, saved secrets appear as ******** — leave them untouched to keep the current value.
You can add as many providers as you like, including more than one of the same product — for example a production and a staging Datadog account.
Step 2 — Attach providers to a fleet
Providers do nothing until a fleet is attached to them.
When you create a Kubernetes fleet, the Basic Configuration step shows How should this fleet be monitored?. Select one or more providers. A fleet can send to several products at once, which is useful during a migration or when two teams watch different tools.
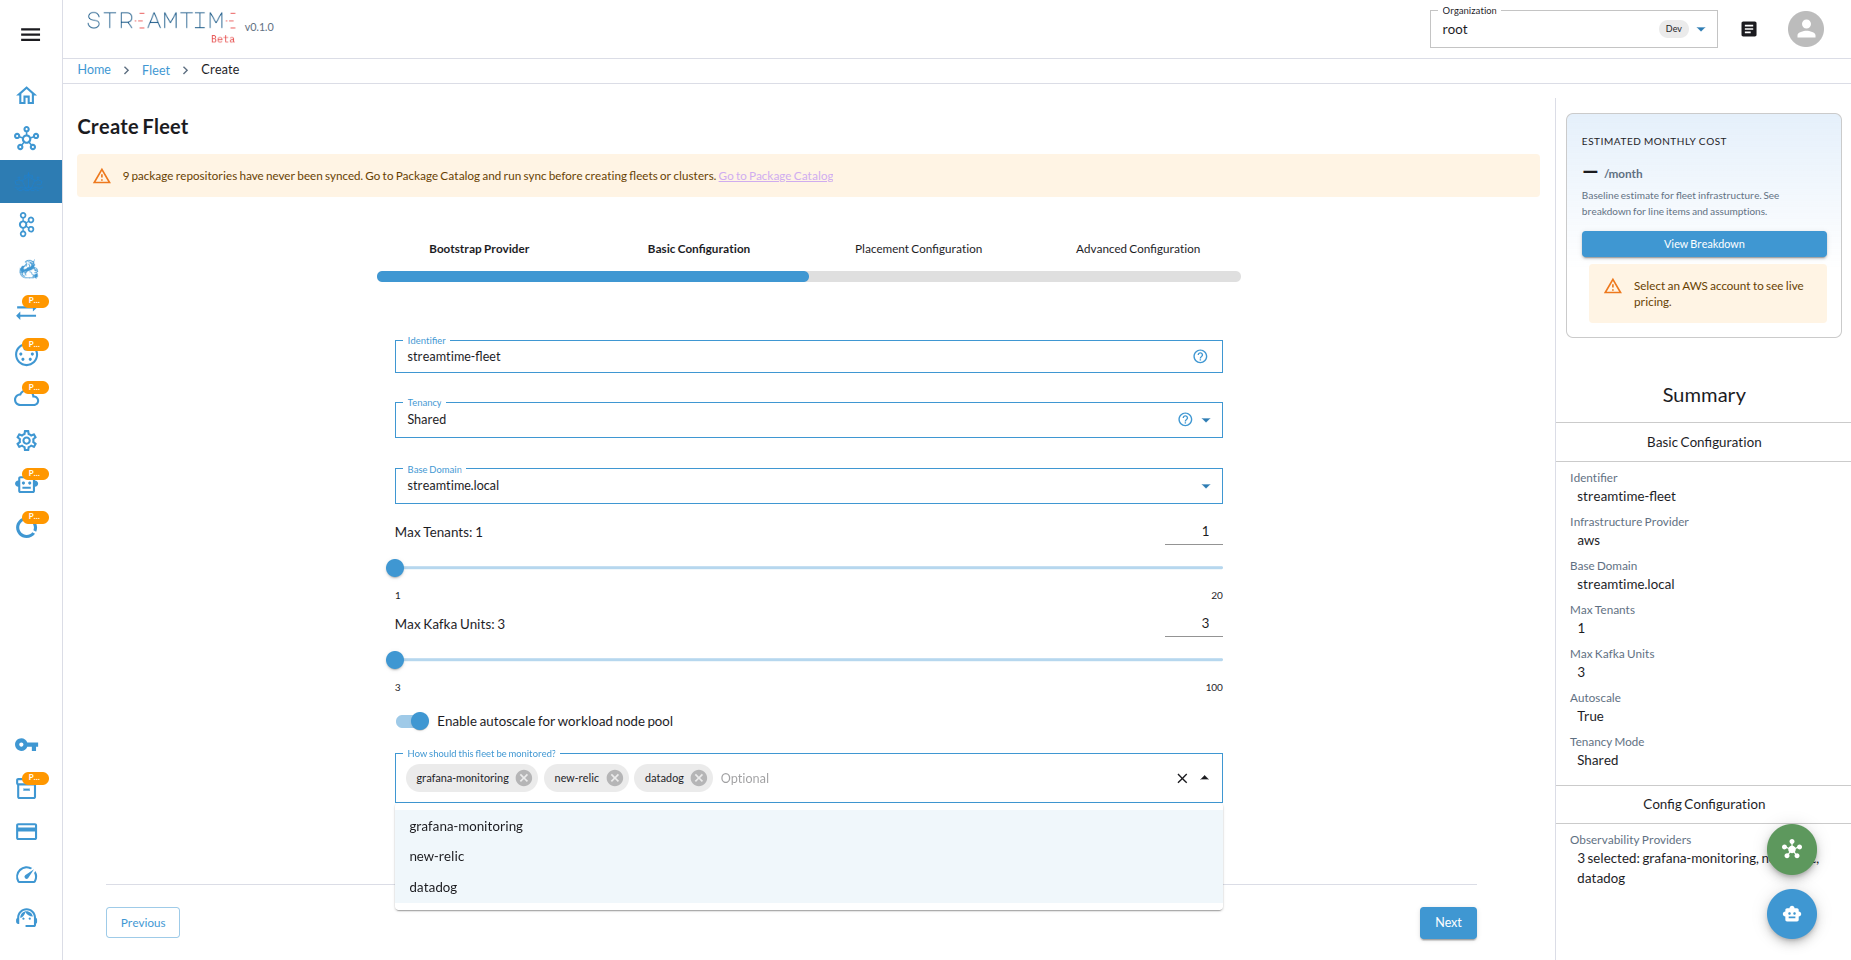
This selector only appears once your organization has at least one provider configured, so complete Step 1 first.
Changing providers on an existing fleet
Fleets that already exist are updated through the API:
curl -sk -X PATCH \
  -H "Authorization: Bearer $TOKEN" \
  -H "Content-Type: application/json" \
  -d '{"config": {"observability_providers": ["datadog-prod", "grafana-staging"]}}' \
  https://<your-streamtime-host>/organizations/<org>/fleet/<fleet>/
The list replaces whatever was attached before, so include every provider you want to keep. Send an empty list to stop forwarding altogether. The change is applied to the running fleet automatically — no rebuild, and no interruption to your Kafka clusters.
Step 3 — Confirm data is arriving
Allow two to three minutes after attaching. Then run one of these in your provider to check that the fleet is reporting.
Replace my-fleet with your fleet’s identifier.
Datadog — Metrics Explorer, then Log Explorer:
sum:kube_node_info{streamtime.fleet:my-fleet}
@streamtime.fleet:my-fleet
Grafana Cloud — Explore, against your Prometheus and Loki data sources:
count(kube_node_info{streamtime_fleet="my-fleet"})
{k8s_namespace_name=~".+"} | streamtime_fleet="my-fleet"
New Relic — the query builder:
SELECT count(*) FROM Metric WHERE `streamtime.fleet` = 'my-fleet' SINCE 15 minutes ago
SELECT * FROM Log WHERE `streamtime.fleet` = 'my-fleet' SINCE 15 minutes ago
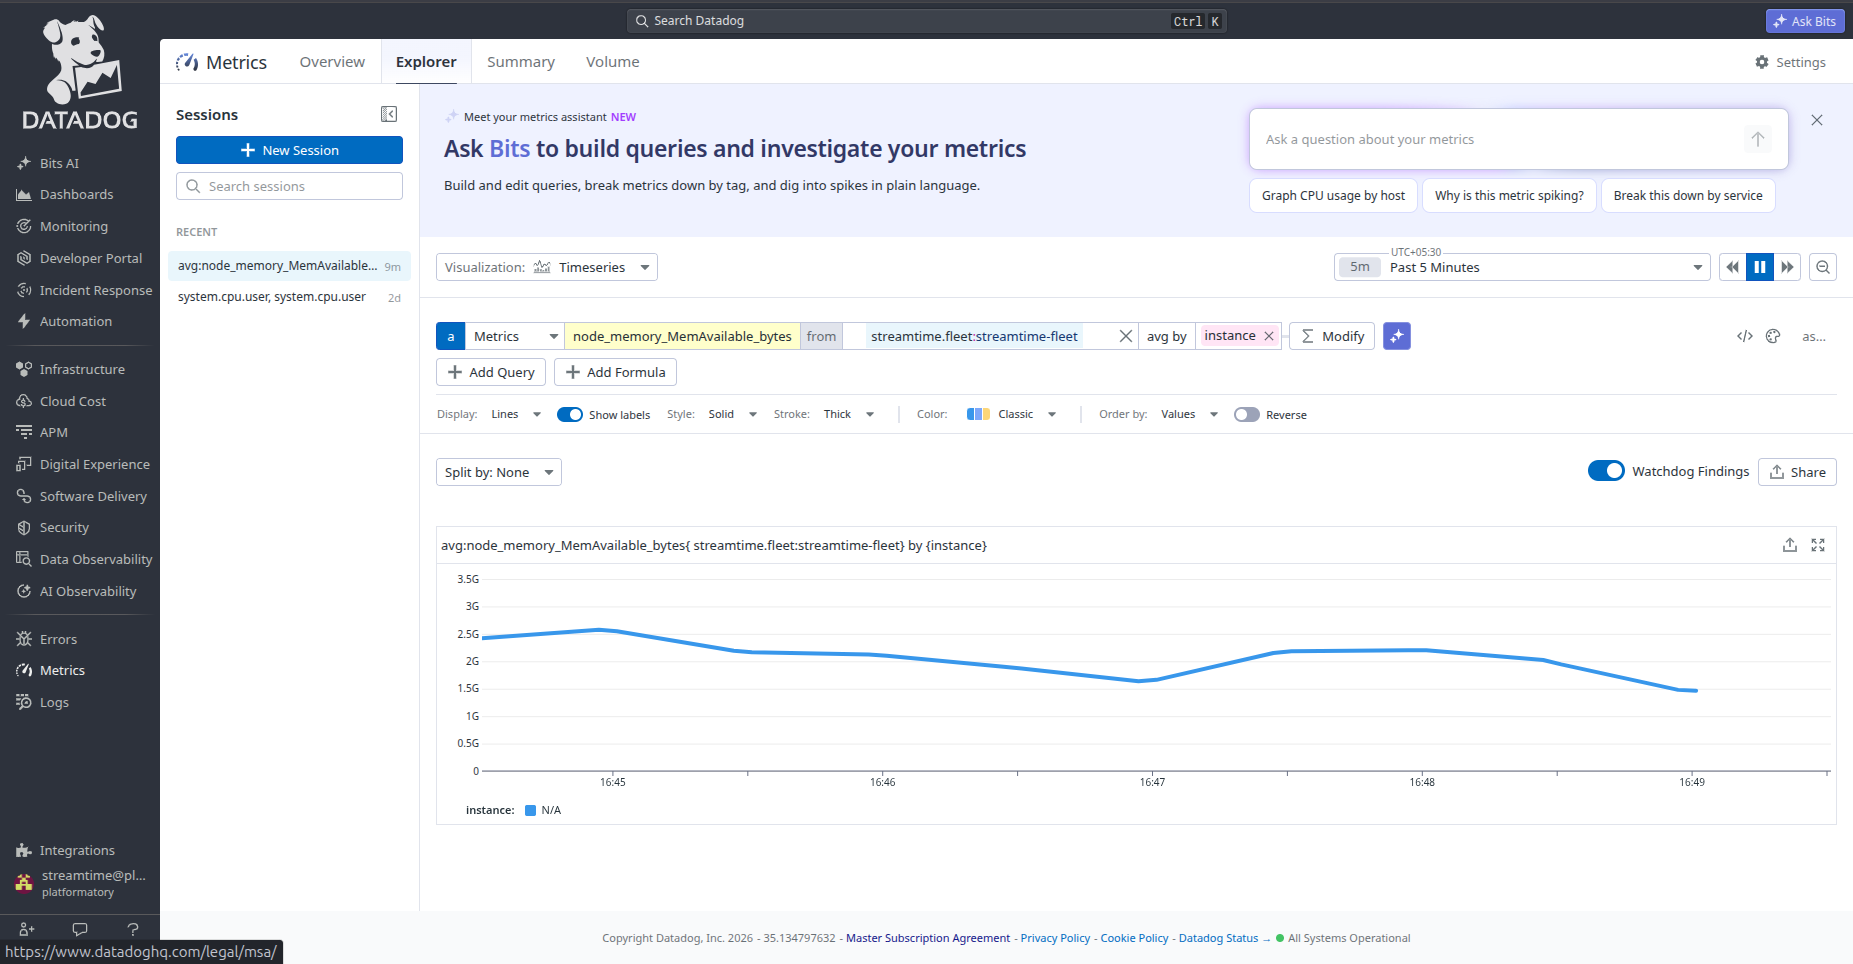
Once data is flowing, build dashboards and alerts using your product’s normal tooling. To narrow to one Kafka cluster, filter on its namespace, which is the same as the cluster’s identifier — for example namespace="my-kafka".
Managing providers
Rotating a credential. Edit the provider and enter the new secret. Every fleet attached to it is updated automatically; you do not need to touch each fleet.
Removing a provider from a fleet. Update the fleet’s provider list, as in Step 2. Forwarding stops; nothing already sent to your account is affected.
Deleting a provider. A provider cannot be deleted while fleets are still attached to it. Detach it from every fleet first.
Troubleshooting
Nothing is arriving. Check the credential first — an expired token, or one without ingest permission, is the most common cause. For Grafana Cloud, confirm the access policy grants write scope for both metrics and logs. Confirm too that the provider is actually attached to the fleet and not only created.
Metrics arrive but logs do not, or the reverse. This usually points at credential scope rather than at Streamtime, since both signals leave over the same connection. Check that your token or key covers both.
Data appears with an unfamiliar tag spelling. Each product rewrites attribute names on ingest. The fleet tag is streamtime.fleet in Datadog and New Relic, and streamtime_fleet in Grafana Cloud. Kubernetes attributes follow the same pattern — a namespace is kube_namespace in Datadog, k8s_namespace_name in Grafana Cloud, and k8s.namespace.name in New Relic.
Log severity looks wrong. Streamtime reads the level out of each log line so that error alerts work in every product. Detection is based on the text of the line, so an application that logs in an unusual format, or a line such as retrying after error, can be classified imperfectly. Filter on message content as well as severity when it matters.
A whole namespace is missing from your logs. Contact Streamtime support — this usually indicates a node the log collector could not run on.