Video Walkthrough: Monitoring a Kubernetes Cluster
Monitoring
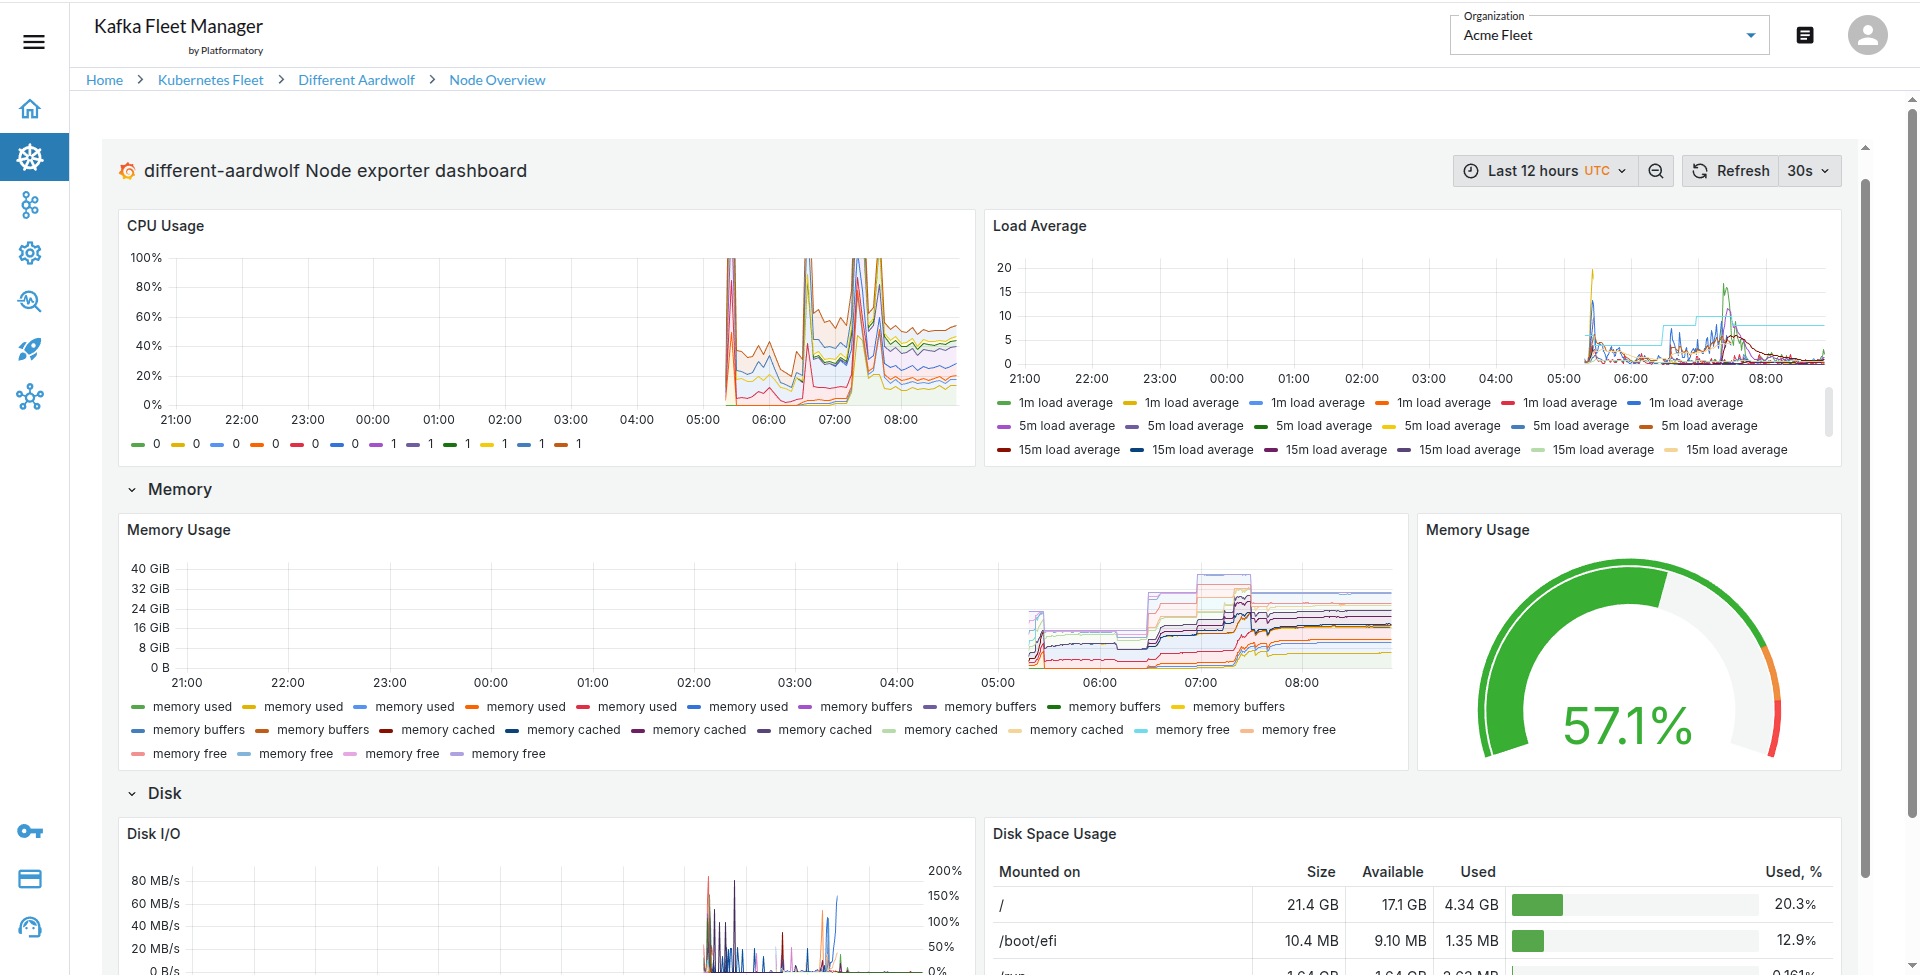
Streamtime provides comprehensive monitoring for both Kubernetes infrastructure and Kafka clusters. All metrics are visualized through integrated dashboards for real-time observability and troubleshooting.
Kubernetes Monitoring
- Cluster Health: Overall status of the Kubernetes fleet.
- Node Metrics: CPU, memory, and storage utilization for each node.
- Metrics Dashboards: Visualize resource usage and identify bottlenecks.
Kafka Monitoring
Video Tutorial: Monitoring a Kafka Cluster
- Cluster Health: Status and availability of Kafka clusters.
- Kafka Operations Metrics: Production and consumption rates, partition distribution, and replication status.
- Metrics Dashboards: Topic-level throughput, latency, and error rates.
Platform-Specific Metrics
- CFK (Confluent for Kubernetes)
- Topic-wise metrics
- Schema Registry metrics
- Confluent platform logs
- Apache kafka
- KRaft (Kafka Raft) metrics
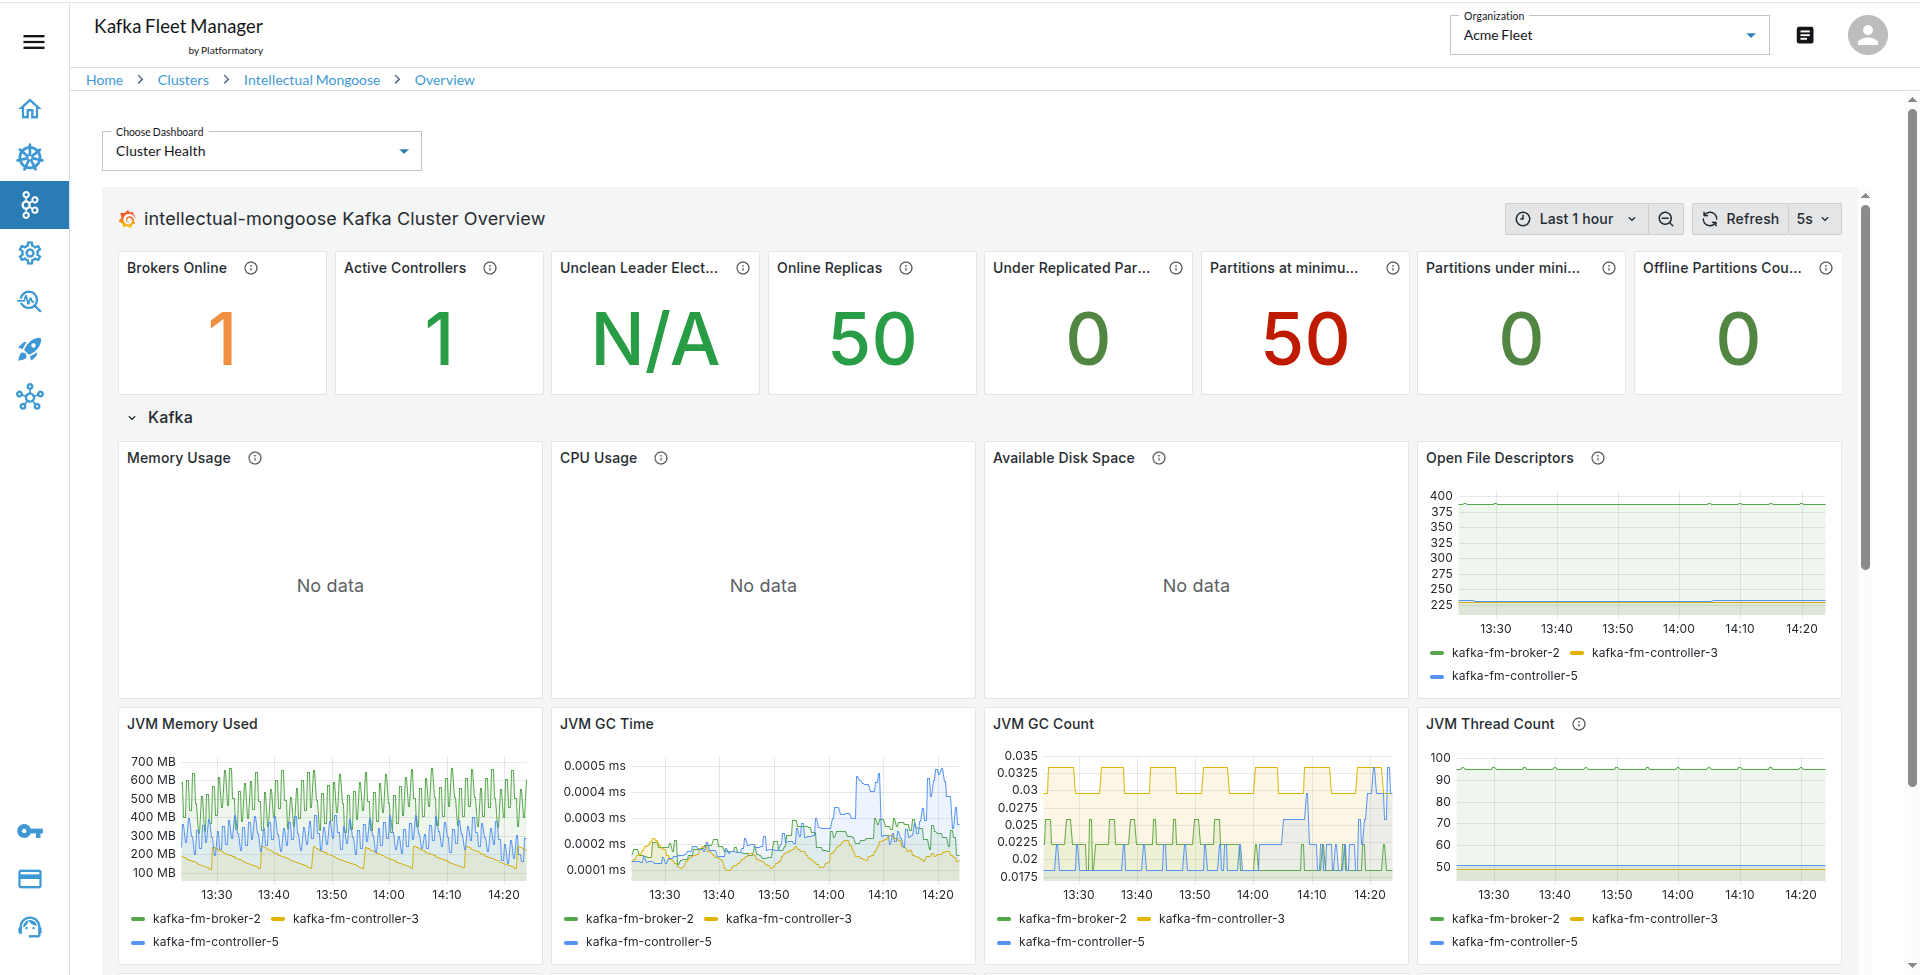
Use the Streamtime UI dashboards to monitor all aspects of your clusters and quickly respond to any issues.
Sending telemetry to your own monitoring product
If your team already uses Datadog, Grafana Cloud, or New Relic, Streamtime can forward a copy of your fleet and Kafka metrics and logs there, so you can alert on Streamtime infrastructure alongside everything else you monitor.
See Bring Your Own Observability.