Video Walkthrough: Monitoring a Kubernetes Cluster
Monitoring
Streamtime provides comprehensive monitoring for both Kubernetes infrastructure and Kafka clusters. All metrics are visualized through integrated dashboards for real-time observability and troubleshooting.
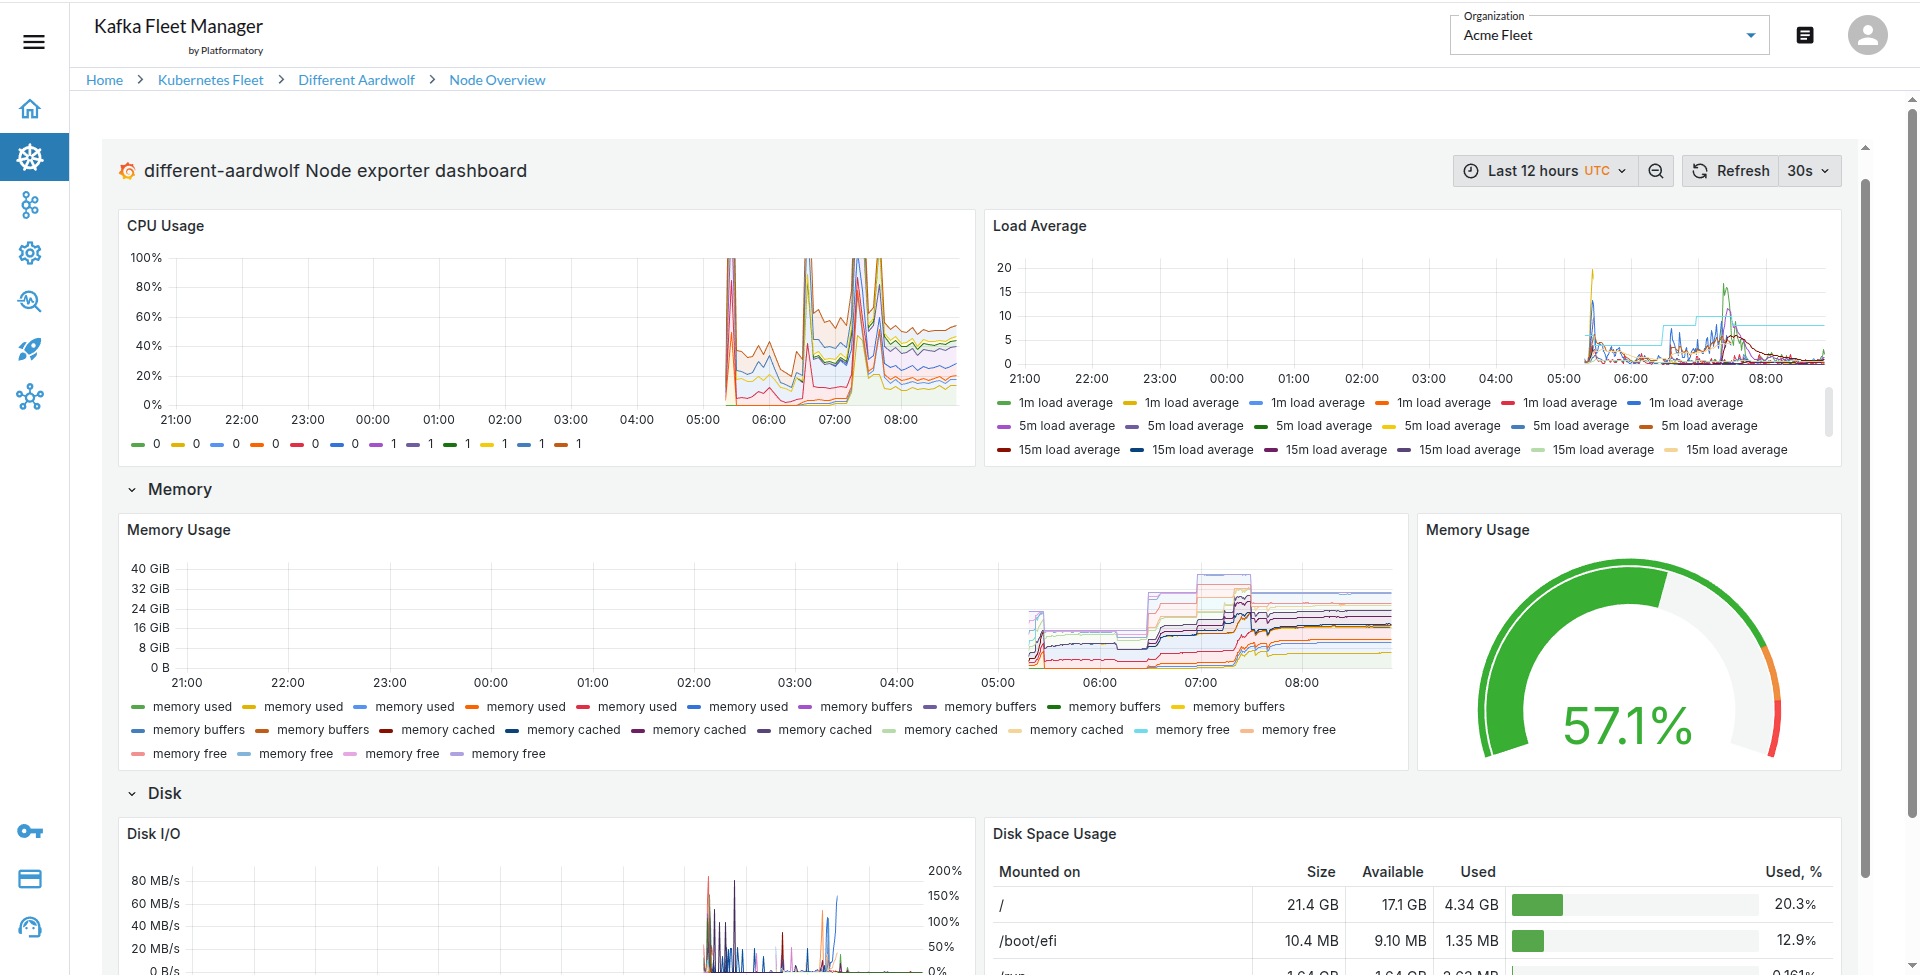
Kubernetes Monitoring
- Cluster Health: Overall status of the Kubernetes fleet.
- Node Metrics: CPU, memory, and storage utilization for each node.
- Metrics Dashboards: Visualize resource usage and identify bottlenecks.
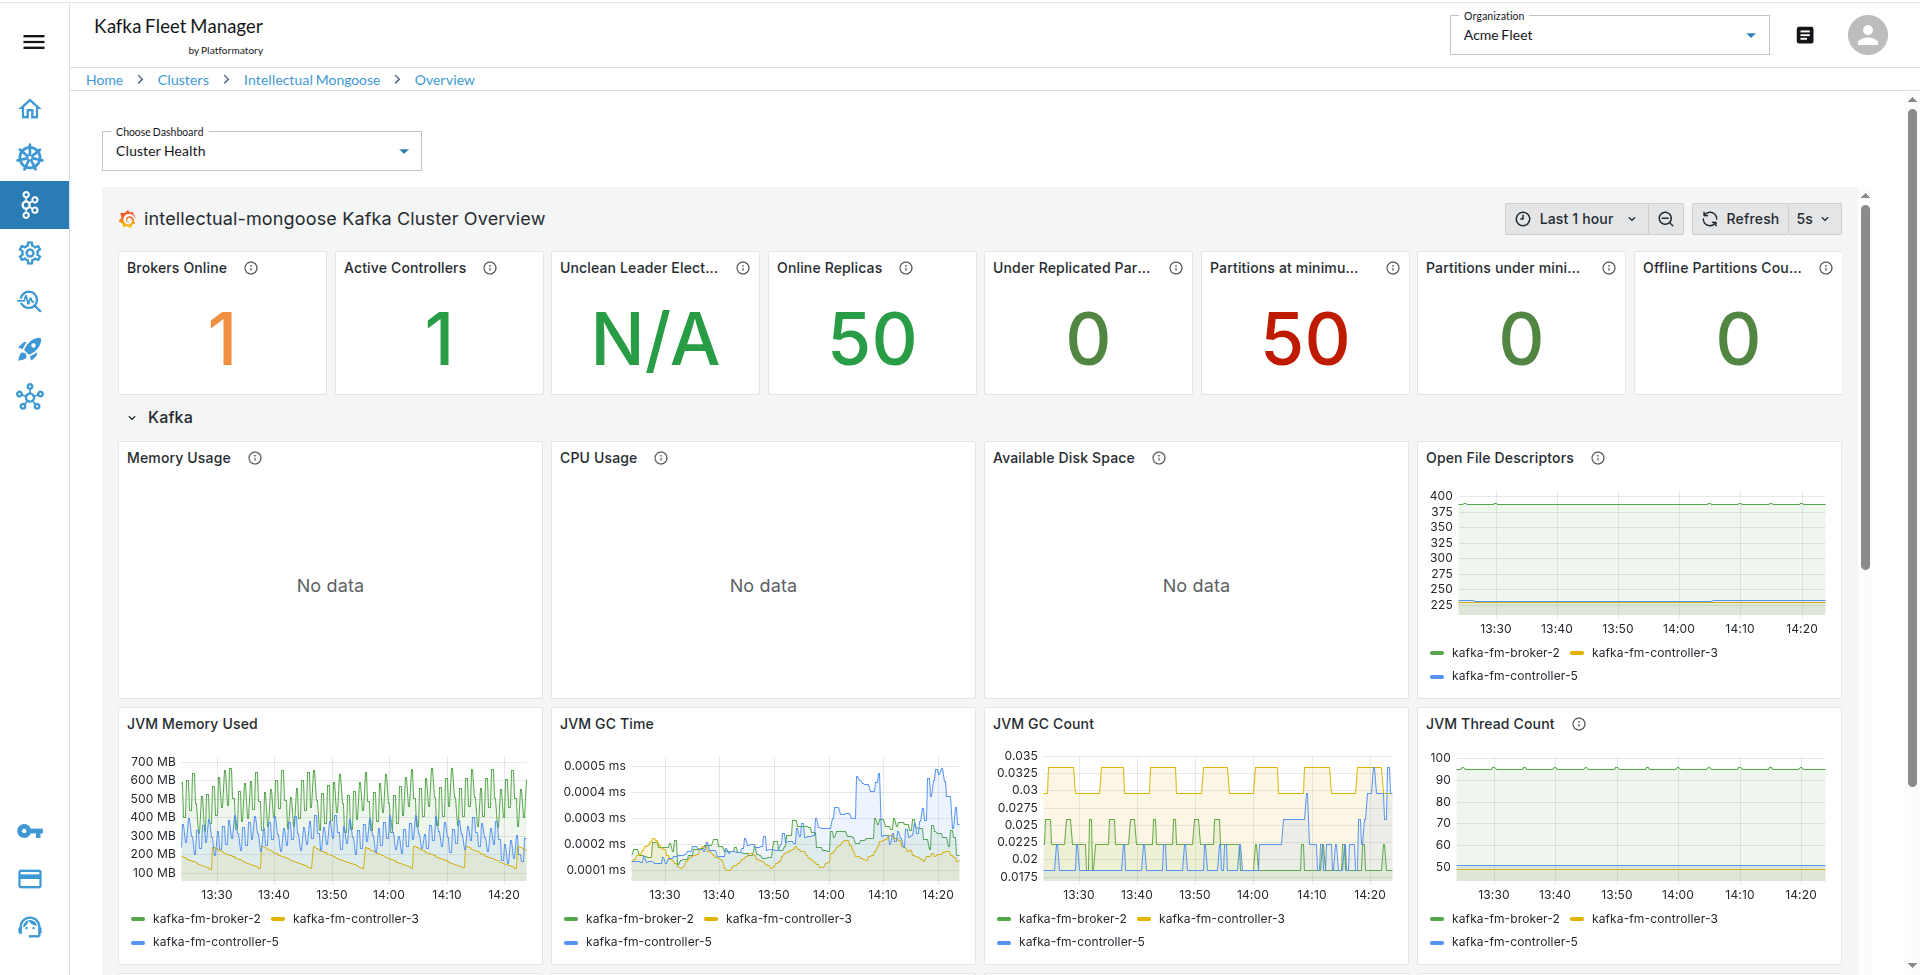
Kafka Monitoring
Video Tutorial: Monitoring a Kafka Cluster
- Cluster Health: Status and availability of Kafka clusters.
- Kafka Operations Metrics: Production and consumption rates, partition distribution, and replication status.
- Metrics Dashboards: Topic-level throughput, latency, and error rates.
Platform-Specific Metrics
- CFK (Confluent for Kubernetes)
- Topic-wise metrics
- Schema Registry metrics
- Confluent platform logs
- Apache kafka
- KRaft (Kafka Raft) metrics
Use the Streamtime UI dashboards to monitor all aspects of your clusters and quickly respond to any issues.